Comparing Binary Ninja Performance on the M1, M2 Ultra, and M3 Pro
We test the time to decompile programs in Binary Ninja over various Mac configurations. No surprise, but the M2 Ultra fared pretty well.

tl;dr: Get more RAM if you want to analyze large executables with Binary Ninja. Then again, we already knew that.
Introduction
As a security researcher, much of my time is spent disassembling and decompiling programs. My tool of choice for this is Binary Ninja, by the Vector 35 team. The other competitors out there are Ghidra and IDA Pro. Hobbyists will be familiar with the former while the graybeards have always used IDA.
Decompilation is no quick feat, especially with larger executables. This slow process is made worse when multiple programs or libraries are relevant to a specific code path that a reverse engineer is interested in. For example, consider how much functionality in *OS is split between the initial executable, the dyld shared cache, and other application via XPC message (a form of IPC).
This isn't a one-time penalty, however. While speed of decompilation is important on initial load, it's almost more important in subsequent analysis. Each time a reverse engineer updates the decompiled output, the decompiler must update the analysis (potentially inter-function). If a new type is applied, that type should propagate forward or backward. If the program's base address is changed, all of the PAC offsets and cross references must change.
Speed matters. A parallel that may be familiar to a wider audience is that of video content creation. A creator using a program like Final Cut Pro or Adobe Premiere cares how long it takes to export a video (at least, if they're using it to make money). They also care how fast they can scrub through footage to apply edits or how many audio tracks they can add.
If these are important, when purchasing a new computer, those creators may opt for a processor with additional video encode engines or GPU cores. For instance, Apple's latest M4 Max has two video encoders compared to the M4 Pro's one. Given the abundance of YouTube videos and blog posts comparing these chips for video editing, this should be easy for someone looking for a new device to quantify.
However, the same cannot be said for reverse engineering. I braved the second page of Google and still found no articles contrasting different processors with the usual reverse engineering tools. The best performance comparison I found was a well-written post by Vector 35's Jordan Wiens on the release of Binary Ninja 3.1. The independent variable in this article, however, was not the CPU, but rather Binary Ninja versions; 3.1 implemented several performance enhancements.
So I took it upon myself to find the answer.
The Experiment
I seek to compare Binary Ninja decompilation performance between Apple silicon processors and different memory configurations. I hope to show the speed improvements in reverse engineering by upgrading machines. In turn, this will justify my purchase of an M4 Pro or M4 Max. 😬
I have three systems readily available, albeit with different configurations of memory. The figure below shows the systems under test.

The control for this experiment will be Binary Ninja version 4.1.5902 and the programs to be decompiled. I selected two programs, one as a more typical example, and one more of a stress test.
The first program is appconduitd present on the iOS build for the iPhone17,1 (16 Pro) on version 18.0.1. It's a daemon that, I believe from a very cursory look, assists with syncing application between the primary device and a paired Apple Watch. The file is ~248KiB and does not have debug symbols.
The second, more intense program, is XUL, a core Firefox library. This is the same program decompiled in Jordan's blog post mentioned above. However, as the post does not mention a version number, I selected the tip of Firefox (change set 846483:10ee512e4eb6, committed Tue Nov 19 22:18:43 2024). It's quite large (at least, for decompiling) at 180MiB and does have debug symbols.
I predict that the M2 Ultra will show the fastest decompilation times, which, to me, is the most important aspect of this experiment. The M2 Ultra has 24 cores, of which are 16 P and 8 E cores. The M3 Pro in this experiment has 12 cores (6 P and 6 E).
Methods
XUL
I compiled Firefox as described in Building Firefox On macOS. I stripped the universal executable with lipo to extract just the arm64e version: lipo -extract arm64 ./XUL -output XUL_arm64.macho
I attached each system to their included power cables to ensure they could complete the experiment without using battery. All systems were restarted. I launched Binary Ninja and restarted without plugins launched (⌘P > Restart Binary Ninja with Plugins Disabled). Then, I launched the macOS profiler, Instruments with a default Activity Monitor sampler. The process was locked to Binary Ninja.
This proved to be too much for the M1 MacBook Air, and the system ran out of memory and killed Binary Ninja. I abandoned CPU and memory profiling for XUL to continue. On a subsequent run, you can see just how much memory total memory was consumed with Activity Monitor.


I restarted each system and launched Binary Ninja without plugins. This time, I ran just Binary Ninja and decompiled XUL and logged the time recorded analysis times logged in the console, found by filtering on "Analysis update took". Note that two analysis times are reported. This experiment, like the blog post mentioned above, tests only the initial analysis times (the first one reported).
appconduitd
I downloaded the iPhone 16 Pro IPSW, extracted the filesystem DMG, and decrypted the AEA format with the following.
$ ipsw download ipsw --version 18.0.1 --device iPhone17,1
$ ipsw extract --dmg fs ./iPhone17,1_18.0.1_22A3370_Restore.ipsw

# Decrypt using the dhinakg/aeota project.
$ get_key.py ./iPhone17,1_18.0.1_22A3370_Restore.ipsw
CKNB1kyVBx/8pc58zOvyOytk4V4trZRmlmVAdGPCxoQ=
$ aea decrypt -i ./044-41598-011.dmg.aea -o 044-41598-011.dmg -key-value 'base64:CKNB1kyVBx/8pc58zOvyOytk4V4trZRmlmVAdGPCxoQ='

# Attach the the disk image and copy the target exeucatble.
$ hdiutil attach ./044-41598-011.dmg
/dev/disk12
/dev/disk13         	EF57347C-0000-11AA-AA11-0030654
/dev/disk13s1       	41504653-0000-11AA-AA11-0030654	/Volumes/Crystal22A3370.D93OS
$ du -h /Volumes/Crystal22A3370.D93OS/System/Library/PrivateFrameworks/AppConduit.framework/Support/appconduitd
248K
I repeated the procedures above to launch Binary Ninja without plugins following a fresh restart. Then I decompiled appconduitd and recorded the analysis times.
As a final test, I wrote a quick script to profile the memory usage when loading appconduitd with the Binary Ninja API. Again, I restarted the systems and ran the Python script, logging both the time to completion and the maximum memory usage. I logged the results.
All times and memory usage floats were rounded up to the nearest integer.
Results
XUL

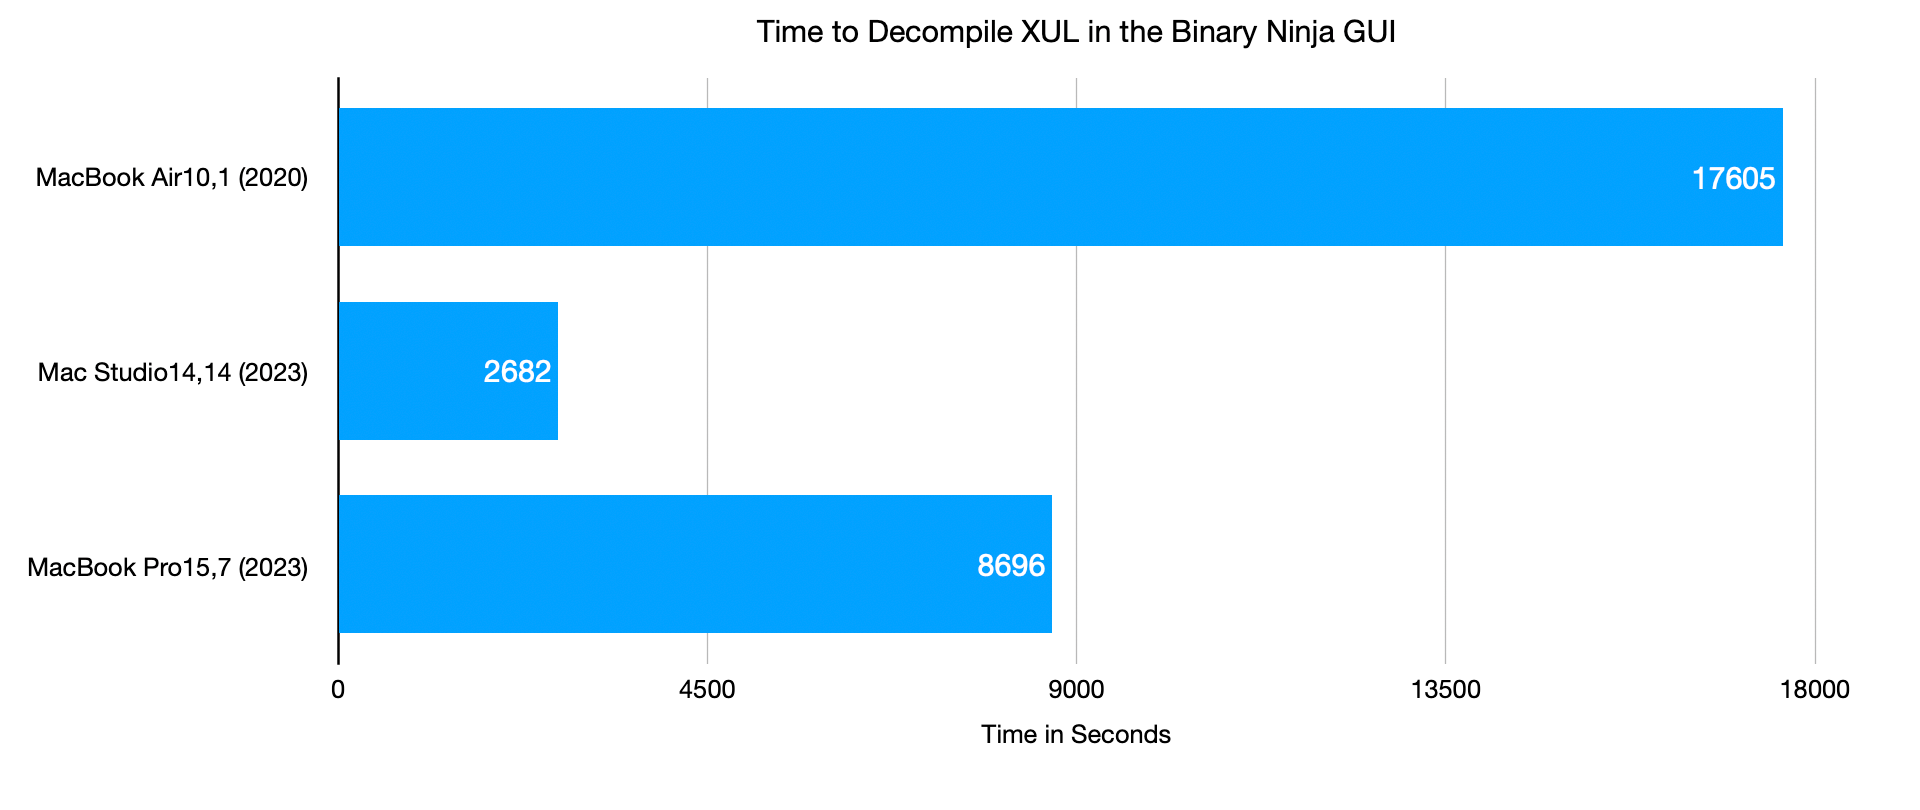
The chart above shows the time to decompile XUL in the Binary Ninja GUI (as opposed to using the commercial headless API). As expected, the Mac Studio absolutely crushed the task. The speed up was a factor of was greater 6 times that of the MacBook Air M1.
Less clear however, is why this speedup occurred. The task was clearly bound by available memory, as XUL consumed 27.57 GB of memory on the MacBook Pro M3 Pro, which only had 18GB of RAM. It's a similar story for the M1 Air. Would the times improve with access to more memory? Almost assuredly.
It's worth pointing out that in the Binary Ninja blog post above, Jordan decompiled XUL (on a different version of Binary Ninja and XUL) on an M1 Max with 64 GB of RAM in 2,460 seconds, faster than what we saw with the M3 Pro.
appconduitd

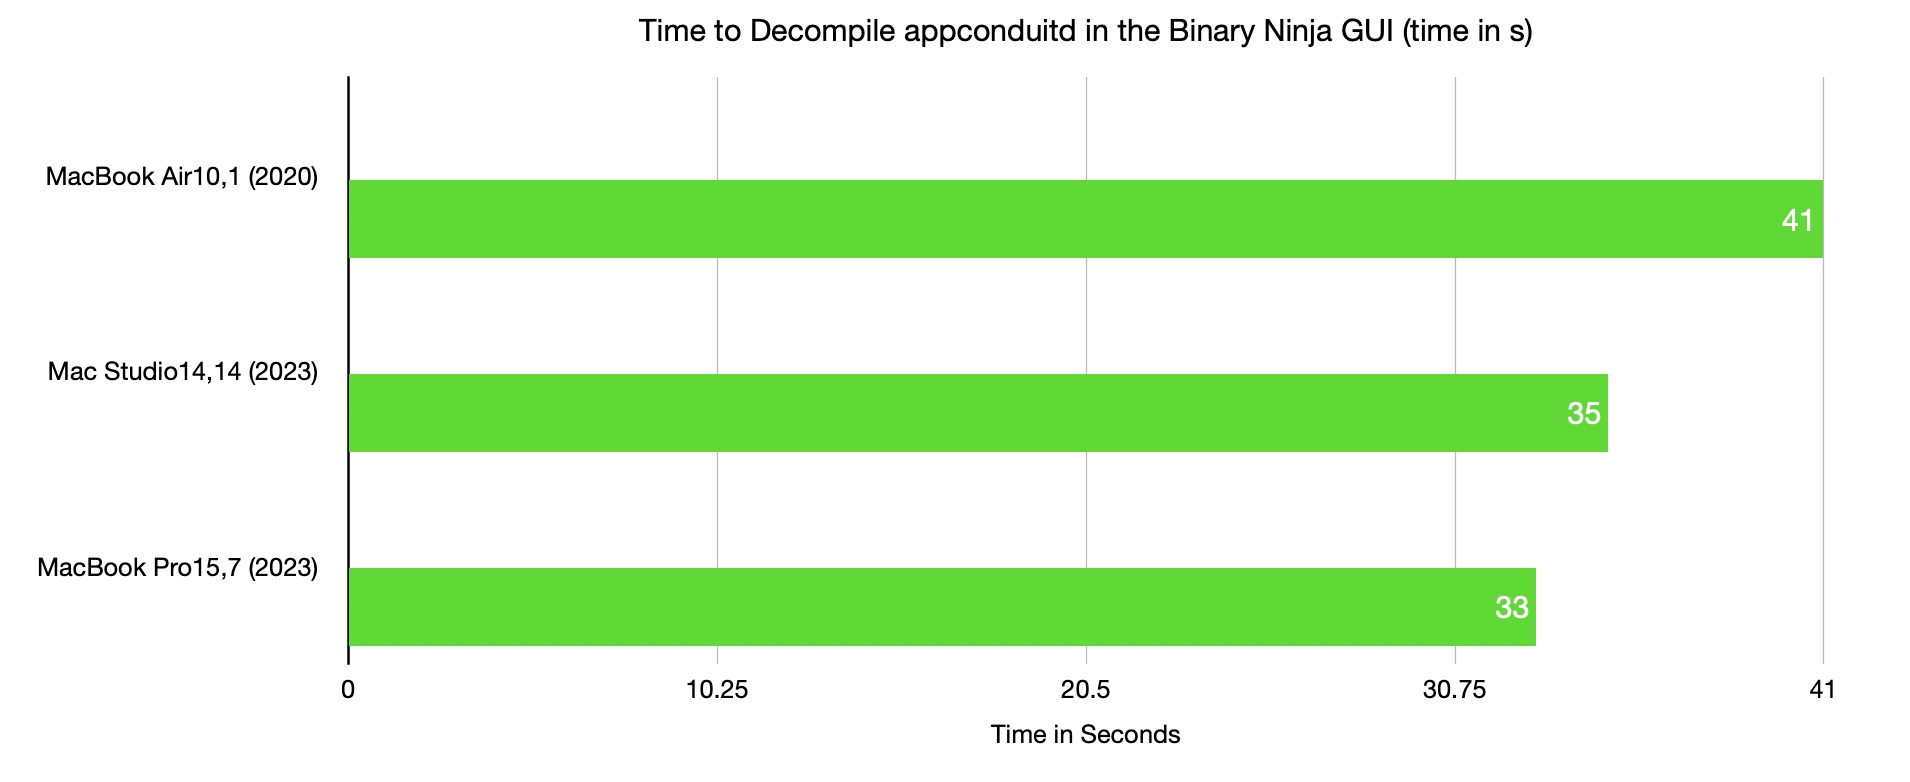
appconduitd showed a different story. The entire analysis fit within 2.6 GB on each system and thus not memory bound. Both newer chips clearly outperformed the M1. I didn't run the experiment multiple times to determine a standard error, but the M2 Ultra and M3 Pro likely fall into that category. It's also likely that single core performance was a contributing factor to the M3 Pro eking out the edge.
appconduitd with the Python API
There was little to no difference in speed when decompiling appconduitd with the GUI compared to the Python API and wasn't worth charting.
Discussion of Results
Given the multiple independent variables (namely memory and RAM), it's unclear why we obtained the results we did. A far more interesting test would be to find an executable whose analysis .bndb file fits within 16GB and retest. That, or splurge on a few more 64 GB systems. 😋
Future experiments could also examine the residency of analysis on P cores with the macOS powermetrics CPU profiler. I suspect, but haven't tested, that analysis largely takes place on the P cores and thus having more, like on the M2 Ultra, would improve analysis times.
So what do you think? Does this give me the data to support getting the M4 Max with the highest amount of cores? I don't think so. Will I do it anyway? Hmmm... If anything, this shows to get the largest amount of RAM that your budget allows if you know you're going to analyze larger executables.
