Decompilers and Performance Cores
How well does Binary Ninja utilize Apple Silicon’s P-cores? More P-cores lead to faster decompilation—worth considering when choosing your next M-series chip.

...and by decompilers I mean Binary Ninja.
How well does Binary Ninja take advantage of performance cores?
I'm in the market for a new laptop to replace my M1 Air. The answer to this question is key to my decision.
It sounds relatively straight forward. We already know that Binary Ninja on better M-series chips is more performant. So it stands to reason that P-cores are largely why. I.e. more P-cores means faster decompilation times.
Let's approach this scientifically.
Activity Monitor
Activity Monitor is a fantastic system sampler that condenses a lot of information into a fairly readable format.
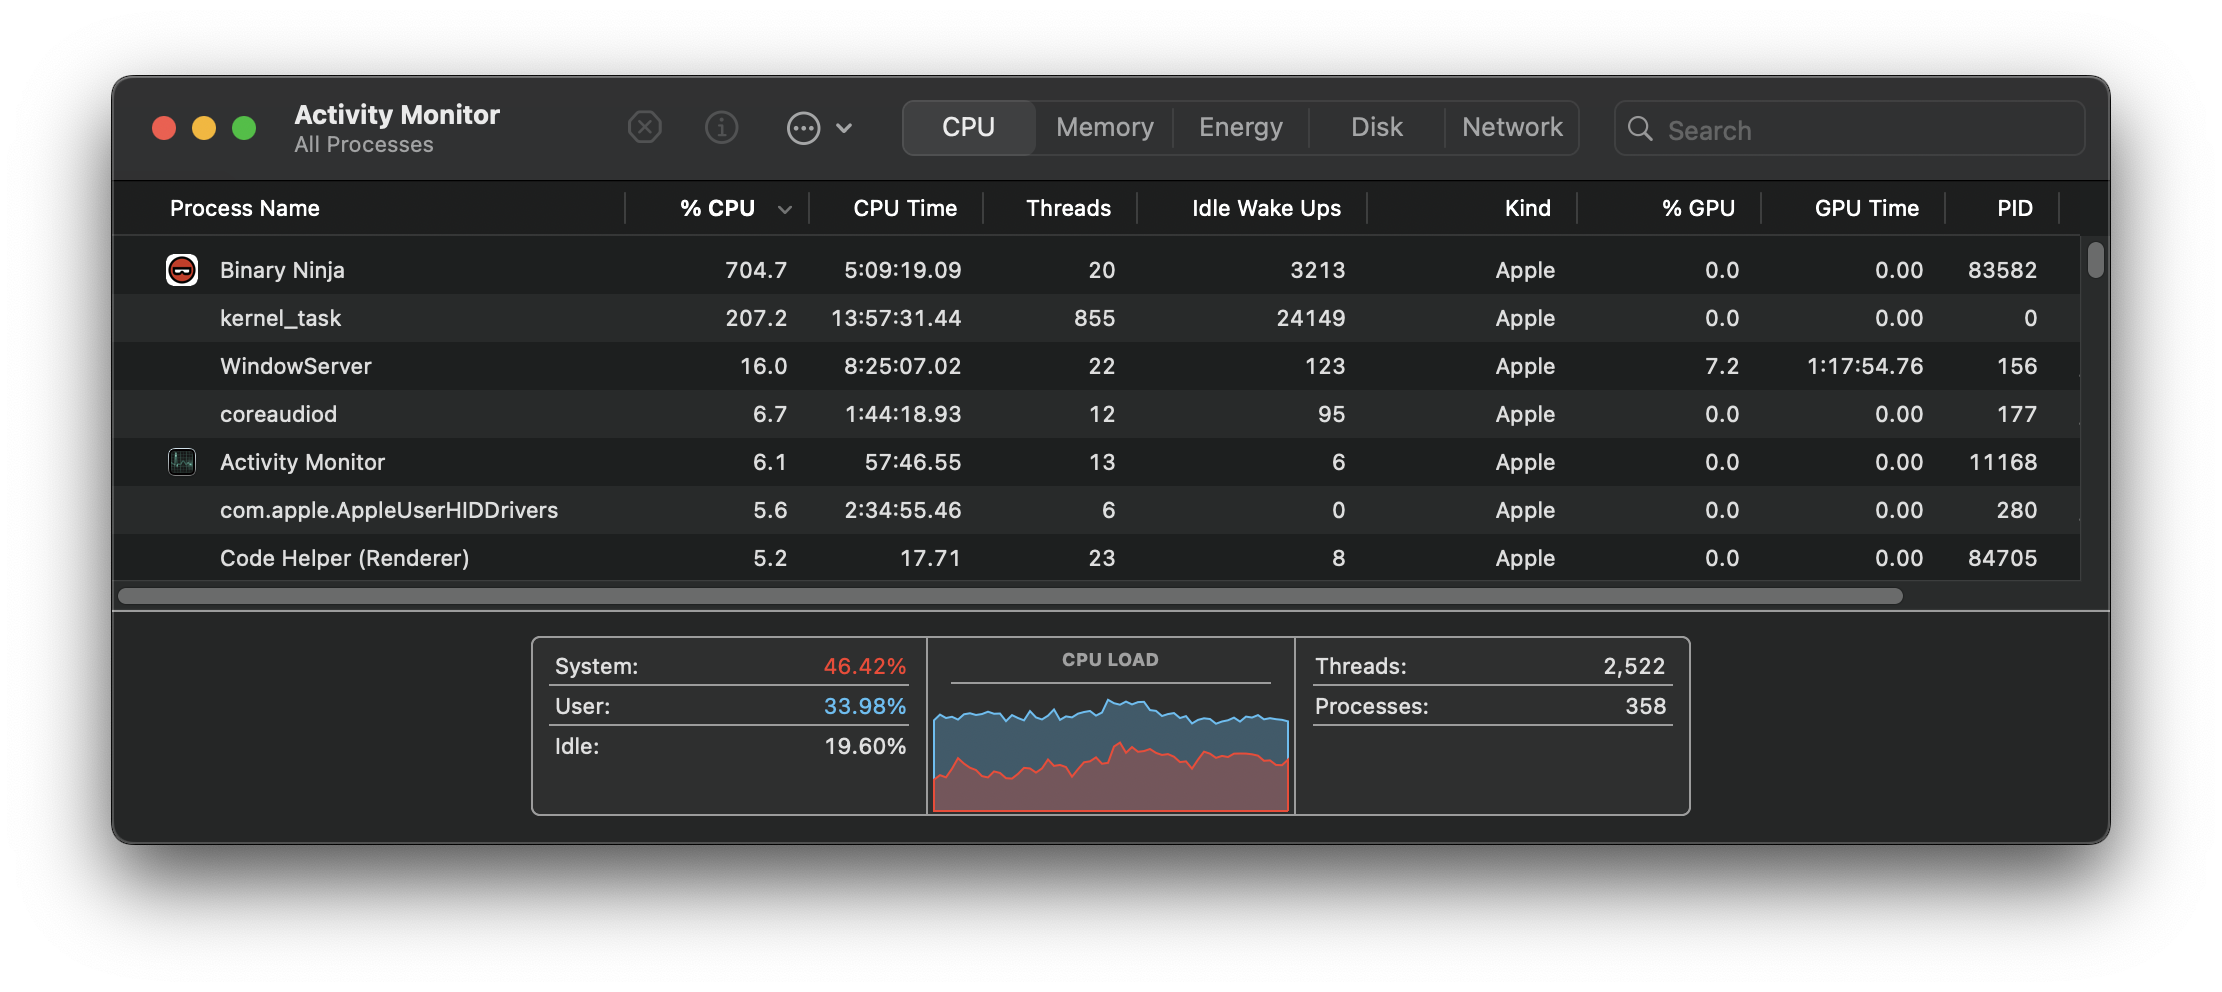
Take for example the output below.

It's clear that Binary Ninja and kernel_task are both tasks that require more processing than others. It even shows how many threads a given process has spawned. Here, Binary Ninja has twenty.
What this doesn't show you is where those threads are running. Howard from The Eclectic Light Co. provides an excellent and eloquent introspection into this problem.
CPU % shows active residency. Active residency is the percentage of CPU cycles that are actually spent processing a thread. This is opposed to idling, usually to conserve energy.
On Apple Silicon, this CPU % can reach up to 100% times the number of cores on your device. Both P-Cores and E-Cores. Note that it does not take into account CPU frequency, which the CPU governor frequently changes on Apple Silicon.
Presumably, the Binary Ninja process above has high QoS threads that instruct macOS to dispatch the threads to P-Cores. After all, I want my decompilation to be as fast as possible.
Testing this Theory
Again, we can't use Activity Monitor to show us per-core CPU residency. But we can still absolutely get that information.
Enter powermetrics. powermetrics is macOS' command line CPU sampler.
$ sudo powermetrics --samplers cpu_power

...lots of output redacted to save space...

P-Cluster idle residency:  92.30%
CPU 6 frequency: 1957 MHz
CPU 6 active residency:   2.53% (696 MHz: .09% 1092 MHz:   0% 1356 MHz: 1.1% 1596 MHz: .12% 1884 MHz: .13% 2172 MHz: .18% 2424 MHz: .29% 2616 MHz: .16% 2808 MHz: .24% 2988 MHz: .18% 3144 MHz: .04% 3288 MHz:   0% 3420 MHz: .00% 3576 MHz: .00% 3624 MHz:   0% 3708 MHz: .00% 3780 MHz:   0% 3864 MHz:   0% 3960 MHz: .00% 4056 MHz: .03%)
...
powermetrics output.
Here we can see the absolute frequency of CPU 6, well as the active residency, with expressed as a percentage at a given frequency. This is a pretty idle P-core. Not being utilized.
With this level of granularity, we can run the decompiler, log the powermetrics output, and inspect the active residency of each of the P-cores.
And that's exactly what I did.
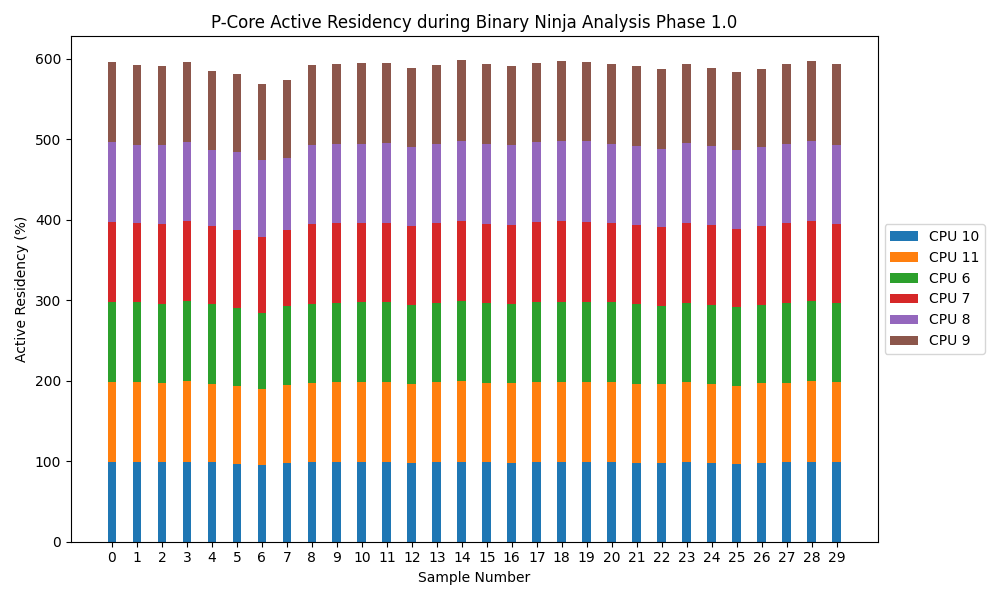
On a binned M3 MacBook Pro, I used powermetrics to sample the CPU 30 times and 1000ms intervals while running Binary Ninja's phase 1 analysis.
Here are the results.

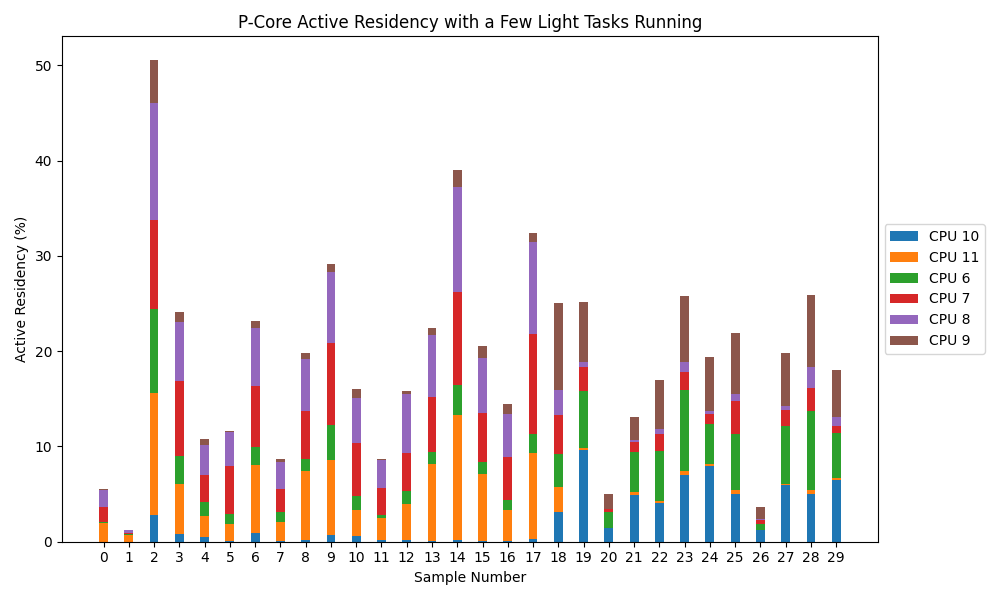
The X-axis reflects the sample (1 second, 2 seconds, etc). The Y-axis reflects active residency of all of the P-cores. The active residency is further broken down to reflect the active residency of each individual core; each color is the active residency of a different P-core.
A fully utilized, 100% active, P-core cluster on this machine would hit 600%; a fully idle cluster would be at 0%. Note that this still doesn't tell us the frequency at which any of these cores were running.
For comparison, below is the what the active residency of this cluster looks like when I just have a few lightweight processes running, like Slack, Music, and Safari (okay, I guess Safari could be pretty intensive).

Interpretation of Results
I think this is enough to reject the null hypothesis. More P-cores improve the speed at which Binary Ninja performs its decompilation in phase 1, the lengthiest part. Assuming you don't have additional workflows, that is.
What does this mean for me? The M4 Pro has two CPU configurations: a binned 12-core and the 14-core CPU. The latter has two additional performance cores. Given these results, at least for me, I think it's worth springing the extra $200 for the additional P-cores.
